Web UI
Lerd includes a browser dashboard available at http://lerd.localhost, served by the lerd-ui systemd service (started automatically with lerd install).
lerd dashboard # open in your default browserThe .localhost TLD resolves to 127.0.0.1 natively on all modern systems, no DNS configuration needed. The dashboard is also reachable directly at http://127.0.0.1:7073 if nginx is not running.
Real-time updates
The dashboard opens a single WebSocket to /api/ws on load and receives state changes as they happen. No polling, no stale panels. Every surface that mutates lerd state (browser actions, lerd CLI commands, the MCP server, the file watcher) pushes a fresh snapshot to every connected tab within about 200 ms. If the WebSocket ever drops (e.g. lerd-ui restart), the dashboard falls back to a 5 s polling loop and reconnects in the background with exponential backoff, so a restart is transparent.
Behind the scenes a background container poll runs every 15 s when at least one tab is visible and the desktop session is active, and drops to 60 s otherwise (every tab hidden, or the session reported idle or locked by systemd-logind). Battery-aware: a focused tab on a locked laptop still falls back to the slow cadence.
Install as an app
The dashboard is a Progressive Web App (PWA). You can install it as a standalone desktop app from any Chromium-based browser (Chrome, Brave, Edge):
- Open
http://lerd.localhost - Click the install icon (⊕) in the address bar
- Click Install
Once installed, Lerd opens in its own window without browser chrome, just like a native app.
A service worker ships with the dashboard, so when lerd is stopped (including via lerd quit) or restarting, the installed PWA shows a small offline landing page instead of the usual browser "this site can't be reached" error. The page surfaces lerd start as the restart command and auto-reloads the dashboard as soon as the backend comes back up.
Layout
The default landing page is a Dashboard with at-a-glance widgets across sites, services, workers, and system health. Selecting Sites, Services, or System switches to a three-pane layout:
- Left icon rail: the lerd logo at the top is the link back to the Dashboard; below it sit the Sites, Services, and System icon buttons; a separator further down lists a per-service icon for every running service that exposes a dashboard (phpMyAdmin, pgAdmin, Mailpit, RustFS, Meilisearch, Mongo Express, Selenium, etc.), and clicking one opens that dashboard inline as a full-width iframe over the middle and detail panels; theme toggle and docs link at the bottom
- Middle list panel: scrollable list of all items in the active section; status dots, compact rows, collapsible groups (hidden on the Dashboard)
- Detail panel: full controls and live logs for the selected item
On mobile the dashboard, list, and detail panels are full-screen with a bottom tab bar for navigation that includes Dashboard alongside Sites, Services, and System.
Dashboard
The Dashboard is the root page (#dashboard) and the default destination when the UI loads. It hides the middle list panel and fills the main pane with a responsive grid of widgets:
- Sites: total / running / paused / failing counts, the top frameworks across linked sites as red badges, and a Link site call to action (loopback only) that opens the same modal as the Sites tab
+button. - Services: an active-vs-total summary pill, a click-through banner when one or more services have updates available, a two-column list of every core service with status dot and version, an Add button (loopback only) that opens the preset picker, and a link into the Services tab.
- Workers: per-group counts (Queues, Schedules, Horizon, Reverb, Stripe, custom Workers), a red pulsing dot when any unit in a group is failing, and a Heal all button that runs the same heal flow as the worker-health banner. Otherwise shows an "All healthy" pill.
- System health: overall pill (Healthy / Attention / Problem) derived from DNS, Nginx, and the file watcher, plus a row per component and a chip per installed PHP-FPM version coloured by its running state.
- Lerd: current version, "Up to date" or a yellow "update available" banner with an Open terminal & update button (loopback only), Autostart and LAN status pills, plus Check for updates and Manage → in the footer.
Every widget is driven by the same Svelte stores that power the rest of the dashboard, so all values stay live over the WebSocket without polling.
Command palette
Press Cmd+K (macOS) / Ctrl+K (Linux/Windows), or / anywhere outside an input, to open a global command palette overlay. It searches across:
- Pages — Dashboard, Sites, Services, System
- Sites — every linked domain, with framework hint
- Services — every core service, with version hint
- Actions — Link a site, Add a service, Heal failing workers (when any), Check for updates, Open documentation, Open current site in browser, Toggle theme
Use ↑ / ↓ to move the selection, ↵ to execute, esc to close. The palette is available on every tab, not just the dashboard.
Sites
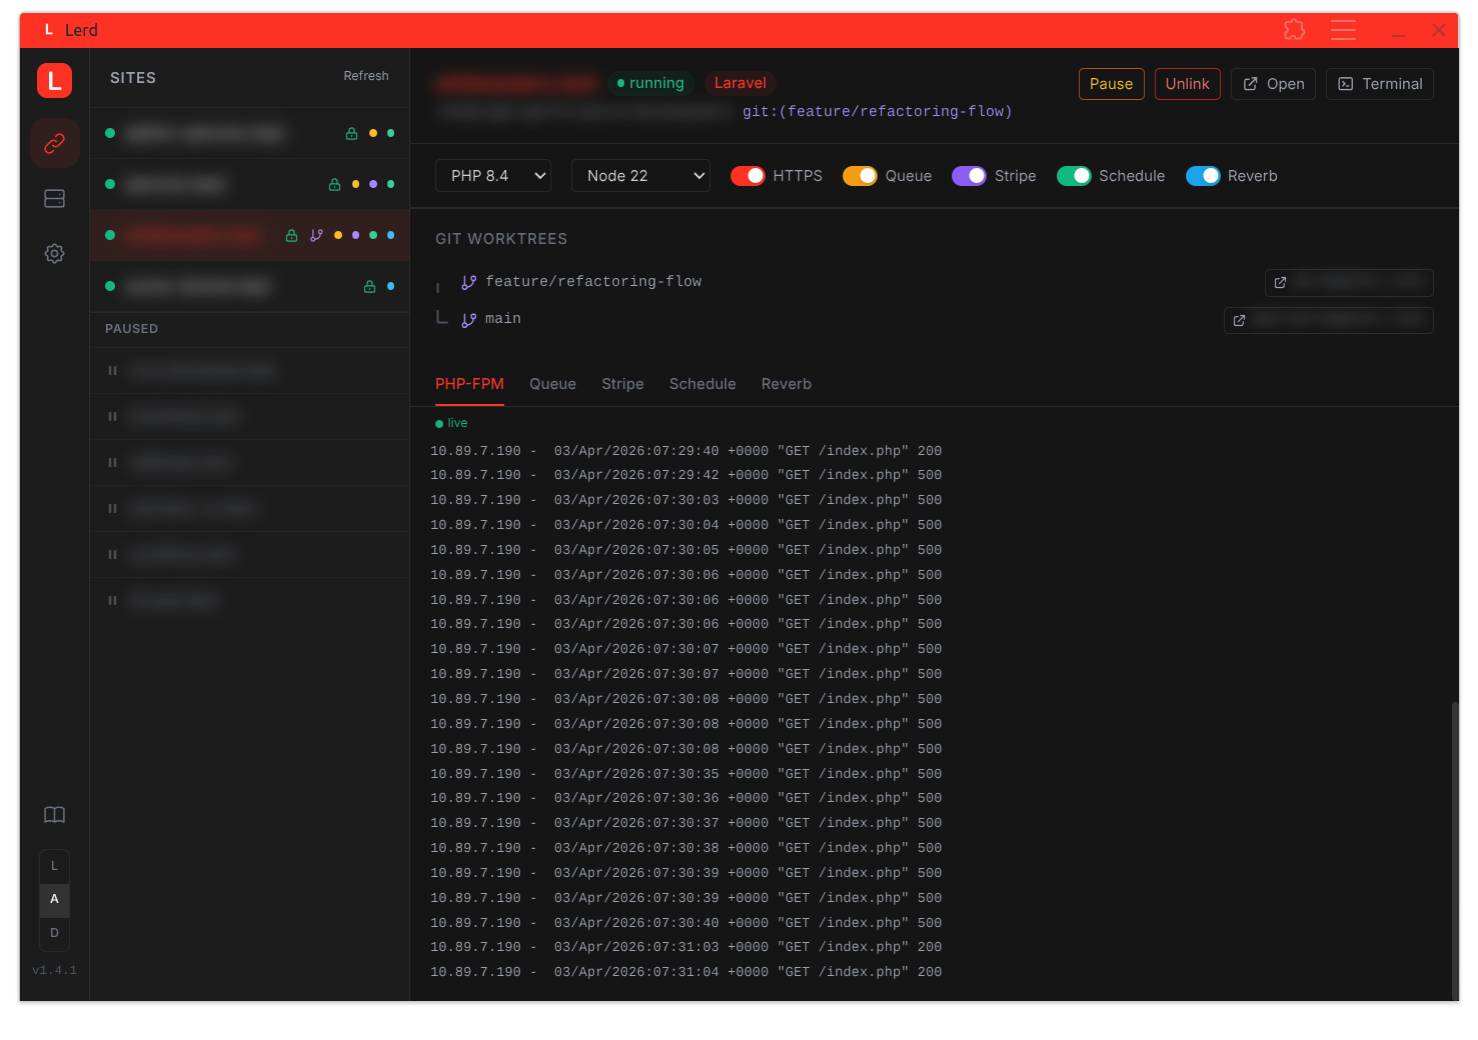
The middle panel lists all registered projects. Active sites show a status dot (green when FPM is running), domain name, and small indicator dots for running workers (amber for queue/horizon, sky for reverb, emerald for schedule, violet for custom workers). Paused sites appear in a separate collapsible section.
Selecting a site opens the detail panel with:
- HTTPS toggle: enable or disable TLS with one click; updates
APP_URLin.envautomatically - PHP / Node dropdowns: change the version per site; writes
.php-version/.node-versioninto the project and regenerates the nginx vhost on the fly - Queue toggle: start or stop the queue worker; amber when running; live log stream below
- Schedule toggle: start or stop the task scheduler; live log stream below
- Reverb toggle: start or stop the Reverb WebSocket server; only shown when the project uses Reverb (detected via composer or
.env) - Framework worker toggles: additional workers defined by the site's framework (e.g. Symfony
messenger, Laravelhorizon) appear as indigo toggles - Stripe toggle: start or stop the Stripe webhook listener
- Pause / Resume: suspend a site's nginx vhost without unlinking it; the site stays registered and FPM keeps running
- Unlink button: remove a site from nginx without touching the terminal
- Git Worktrees: when the project uses git worktrees, each branch and its domain are listed with a direct open link
- Live PHP-FPM log: streams FPM output for the selected site; tab switches to queue/horizon/schedule/reverb logs when those workers are running
- Service badges: beneath the path / git branch line, every service from the project's
.lerd.yamlis shown as a small pill (green when running, grey when stopped). Click any badge to jump to that service's detail panel on the Services tab.
Services
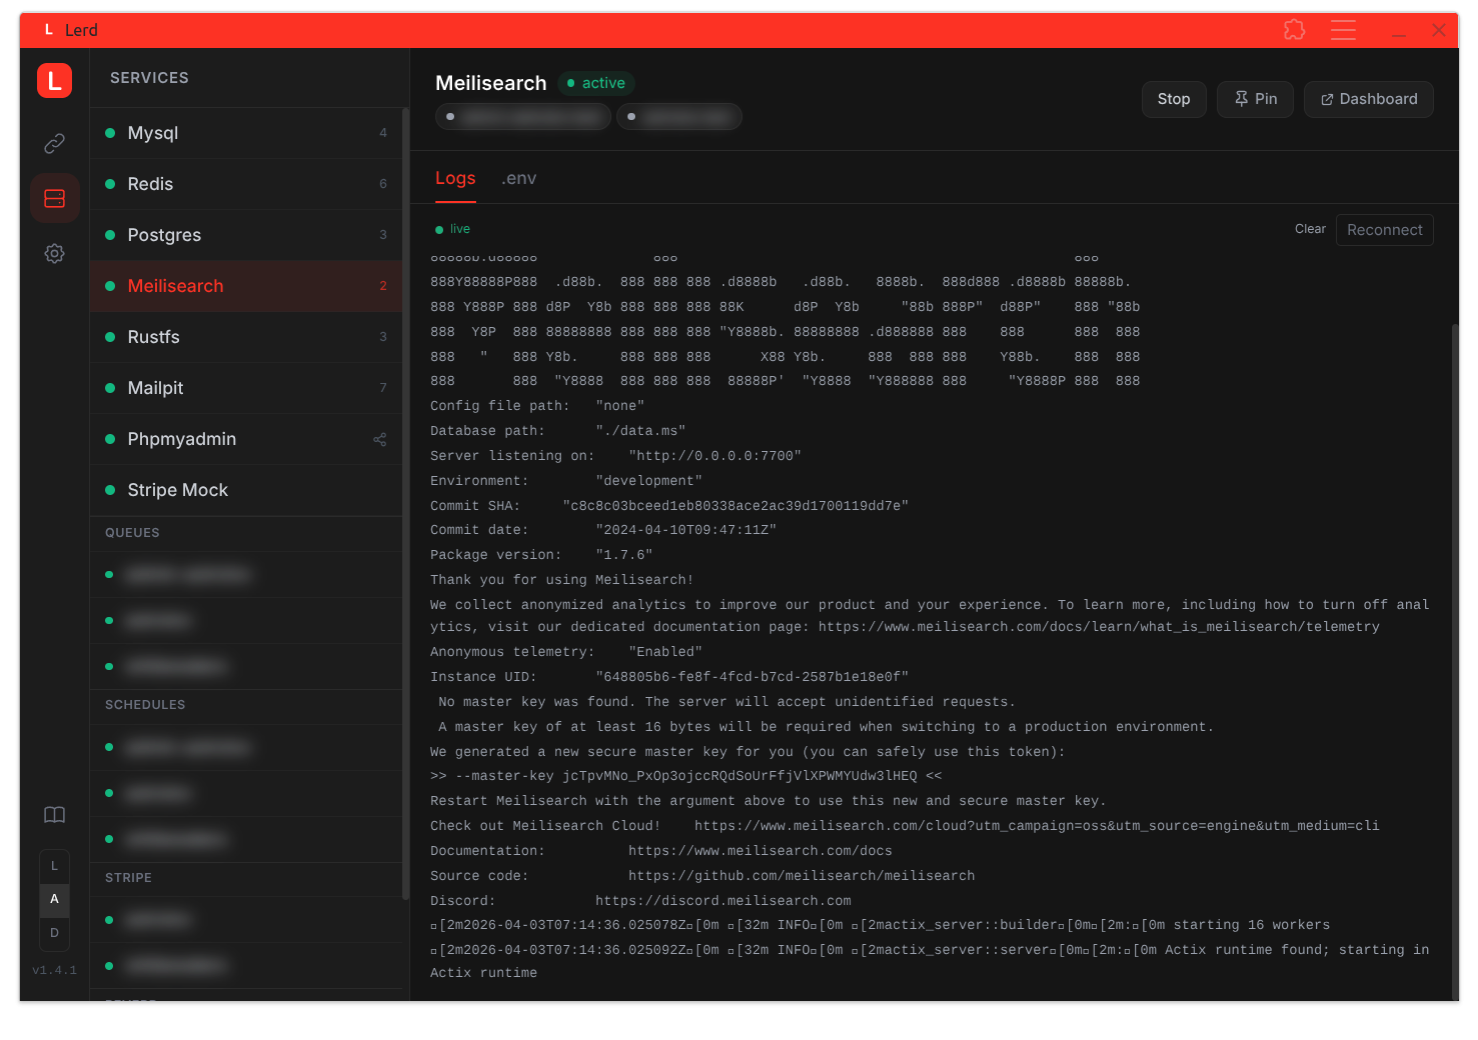
The middle panel lists core infrastructure services (MySQL, Redis, PostgreSQL, Meilisearch, RustFS, Mailpit), any installed preset alternates (e.g. MySQL 5.7, MariaDB 11, MongoDB) and admin UIs (phpMyAdmin, pgAdmin, Mongo Express), plus grouped per-site workers (Queues, Horizon, Schedules, Workers, Stripe, Reverb).
The header has a + button that opens the preset picker modal: a one-click installer for the bundled service presets. Multi-version presets like mysql and mariadb show a version dropdown next to the Add button. Already-installed entries are filtered out.
Selecting a service opens the detail panel with Start, Stop, and Restart controls, status, and the correct .env connection values with a one-click copy button. Restart is available for every built-in and custom service and wraps podman restart (clears the paused flag on success); the grouped per-site workers (Queues, Horizon, Schedules, Workers, Stripe, Reverb) remain start/stop only. Database service detail panels (mysql, postgres, mongo, and any installed alternate like mysql-5-7) get two extras:
- Suggestion banner: a sky-blue tip offering to install the paired admin UI (phpMyAdmin / pgAdmin / Mongo Express) when it isn't installed yet. Dismissable per-preset; dismissal persists in
localStorage. - Open admin button: when the paired admin UI is installed, a button on the header opens its dashboard inline as a full-width iframe overlay and auto-starts the admin service if needed. When no admin UI is installed and the service is active, a fallback Open connection URL anchor hands the
mysql:///postgresql:///mongodb://URL to your registered DB client (DBeaver, TablePlus, Compass, etc.). - Dashboard button: for any service that exposes a dashboard URL (Mailpit, RustFS, Meilisearch, phpMyAdmin, etc.), a Dashboard button in the header opens it as an inline full-width iframe. The iframe overlay has its own header with the service URL, an Open in new tab escape hatch, and a close button. Clicking one of the main nav icons (Sites / Services / System) also closes the overlay.
System
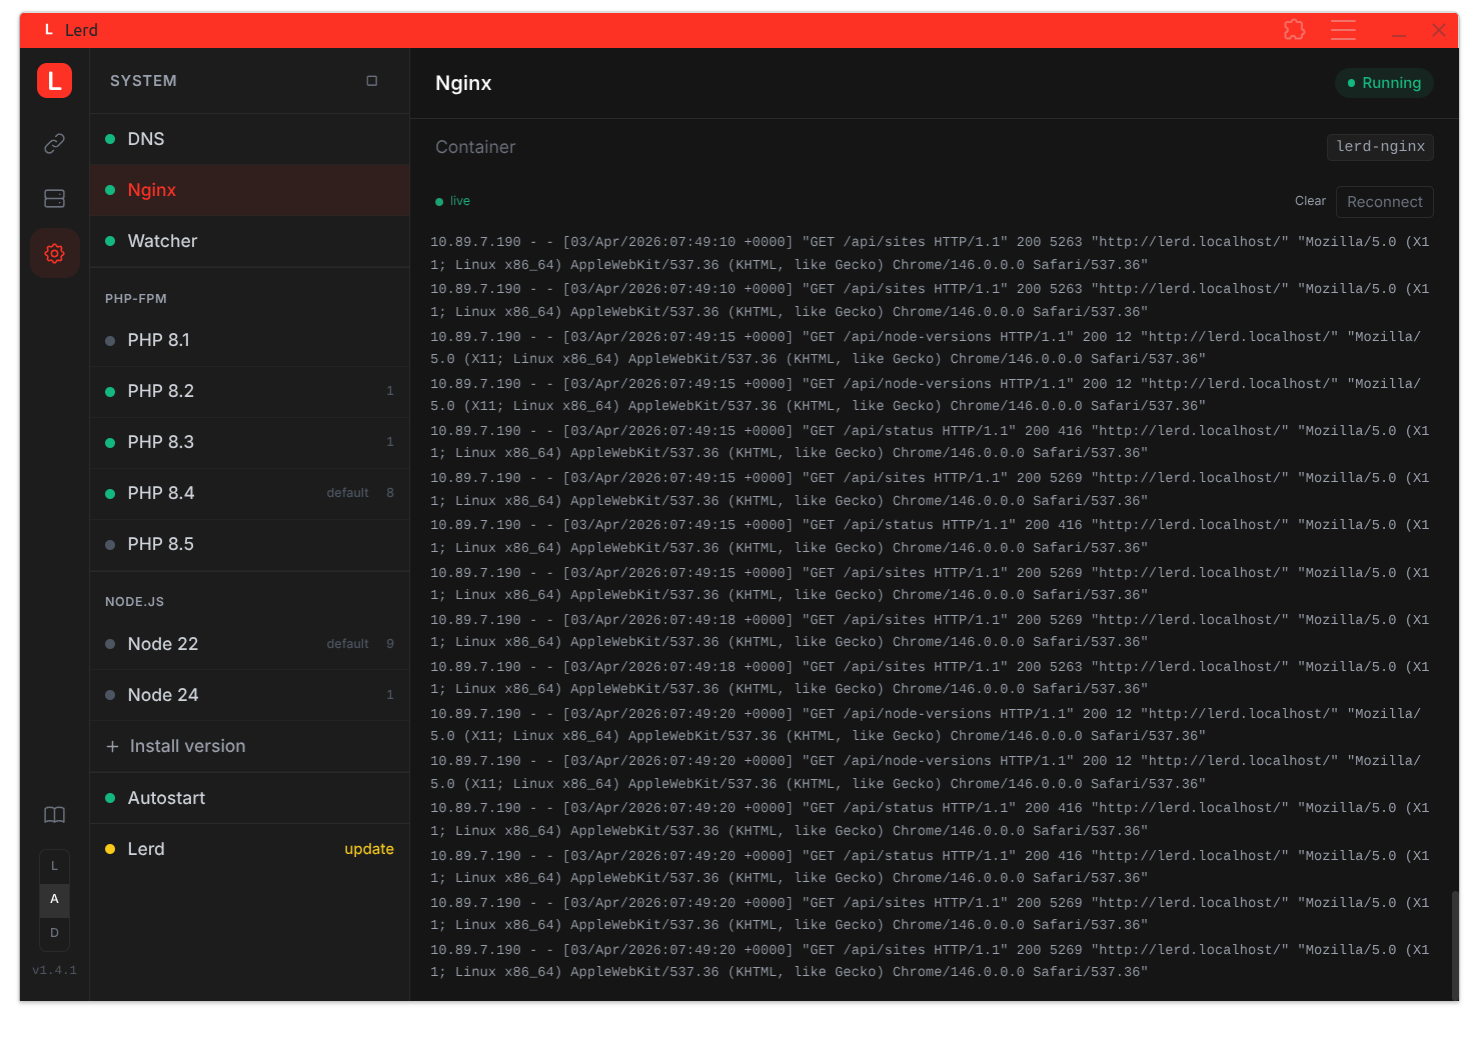
The middle panel lists individual system components: DNS, Nginx, Watcher, each installed PHP-FPM version, each installed Node.js version, the Node install form, Autostart toggle, and the Lerd version entry.
Selecting an item opens its detail panel:
- PHP-FPM cards: show which sites use the version, Xdebug toggle with an inline mode selector (debug, coverage, debug-plus-coverage, develop, profile, trace, gcstats, visible when Xdebug is on), custom extension list, and a live FPM log stream. For versions with no active sites, a manual Start/Stop button is shown.
- Site Xdebug chip: every site detail shows a small Xdebug chip in the services row, purple with the active mode when on, gray with
offwhen disabled. Clicking the chip jumps to that PHP version's FPM card so you can flip the state without leaving the site. - Node.js cards: show which sites use the version, with a remove button. The Install Node.js version entry has an inline form; enter a version number (e.g.
22) and click Install, equivalent tolerd node:install <version>. - Watcher card: shows whether
lerd-watcheris running; a Start button appears when stopped. Streams live watcher logs (DNS repair events, fsnotify errors, worktree timeouts). - Autostart card: enable or disable automatic start of all services at login.
- Lerd card: shows the current version and a Check for updates button. The status dot next to the entry is green when DNS, nginx, and the watcher are all running, red when any of them is down, and yellow when an update is available. When an update is available, an Open terminal & update button spawns the user's preferred terminal emulator with
lerd updatepre-filled (loopback only, the host needs to prompt for sudo). A small yellow dot also appears on the lerd logo in the left rail; clicking the logo always returns to the Dashboard, where the same update banner is surfaced on the Lerd widget.
The Start / Stop buttons in the System panel header start or stop all core services (DNS, nginx, and all PHP-FPM containers for versions that have active sites).
Updates
Shows the current version. When an update is available, the Lerd entry exposes an Open terminal & update button that launches your terminal emulator running lerd update. The update requires sudo for sysctl/sudoers steps and so needs an interactive terminal; the button is loopback-only and is hidden when the dashboard is reached over the LAN.